Improved timezone overlay formatting and sidebar icon fix. Learn More
Improved timezone overlay formatting and sidebar icon fix
April 01, 2026
Improvement
- Update
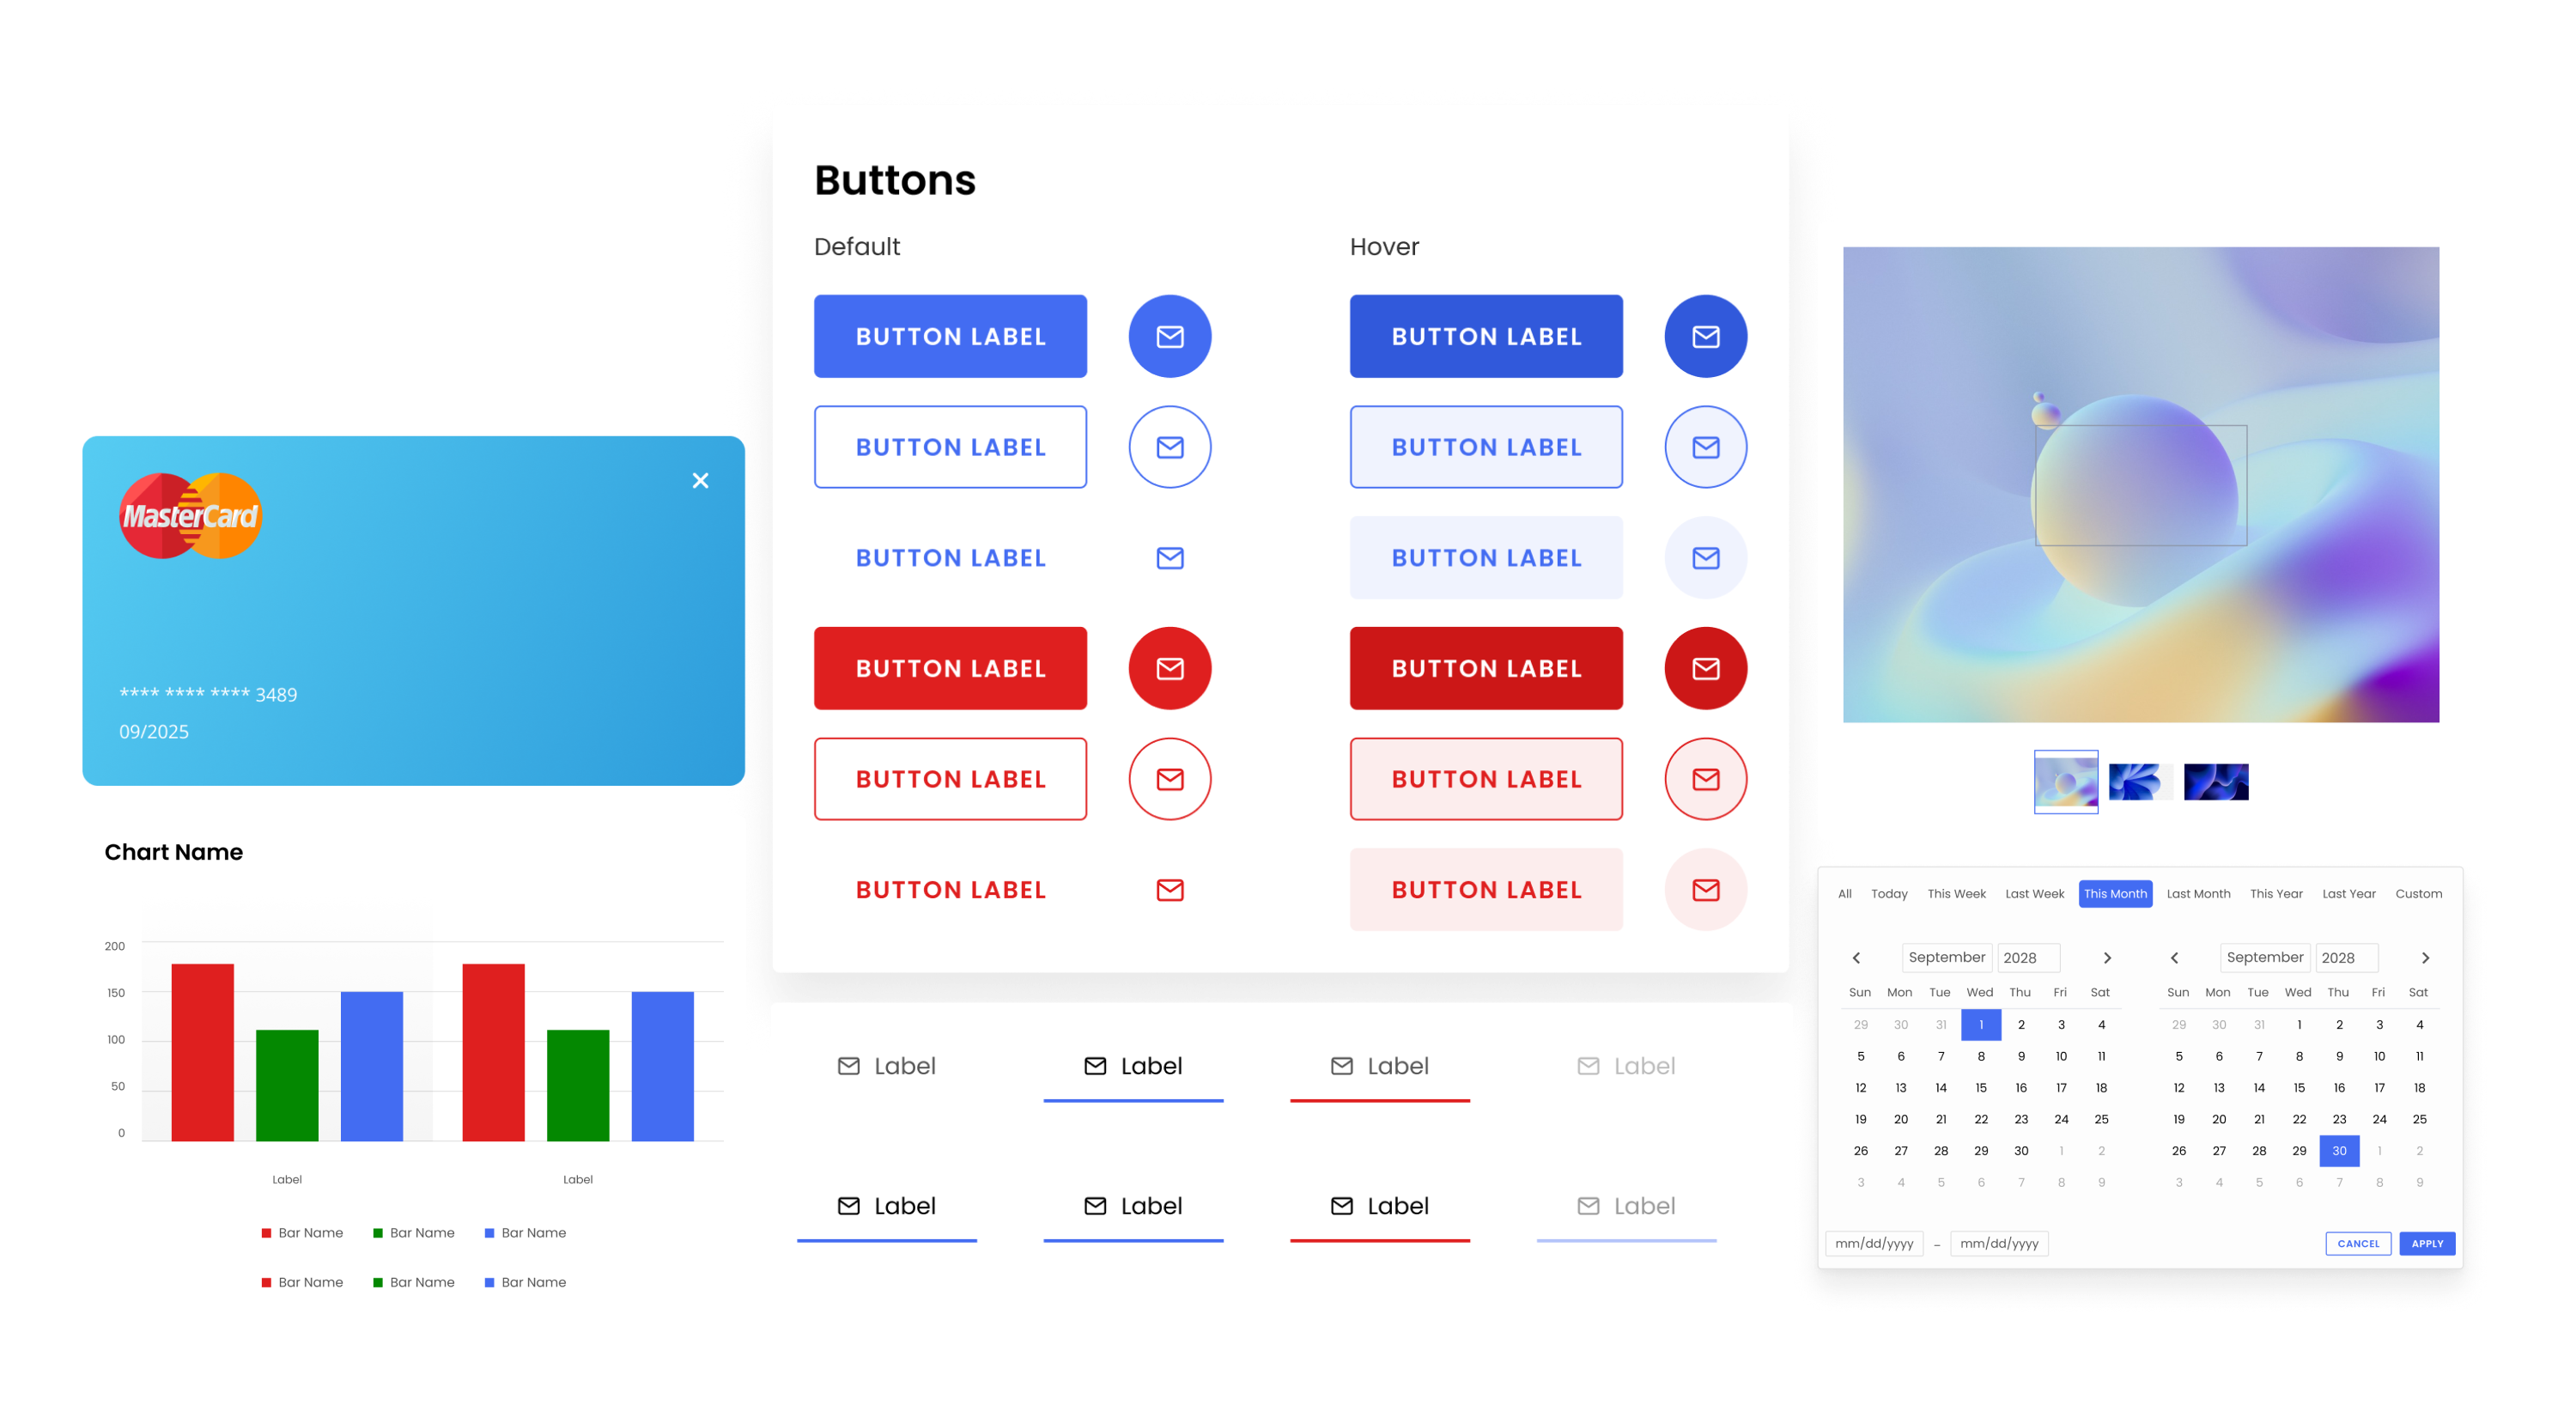
ins-tableTimezone Overlay formatting.
Bug Fix
- Fix
ins-sidebar-itemicon flickering issue on hover.
New event ticket tracking and enhanced admin activity logs
April 01, 2026
New Features
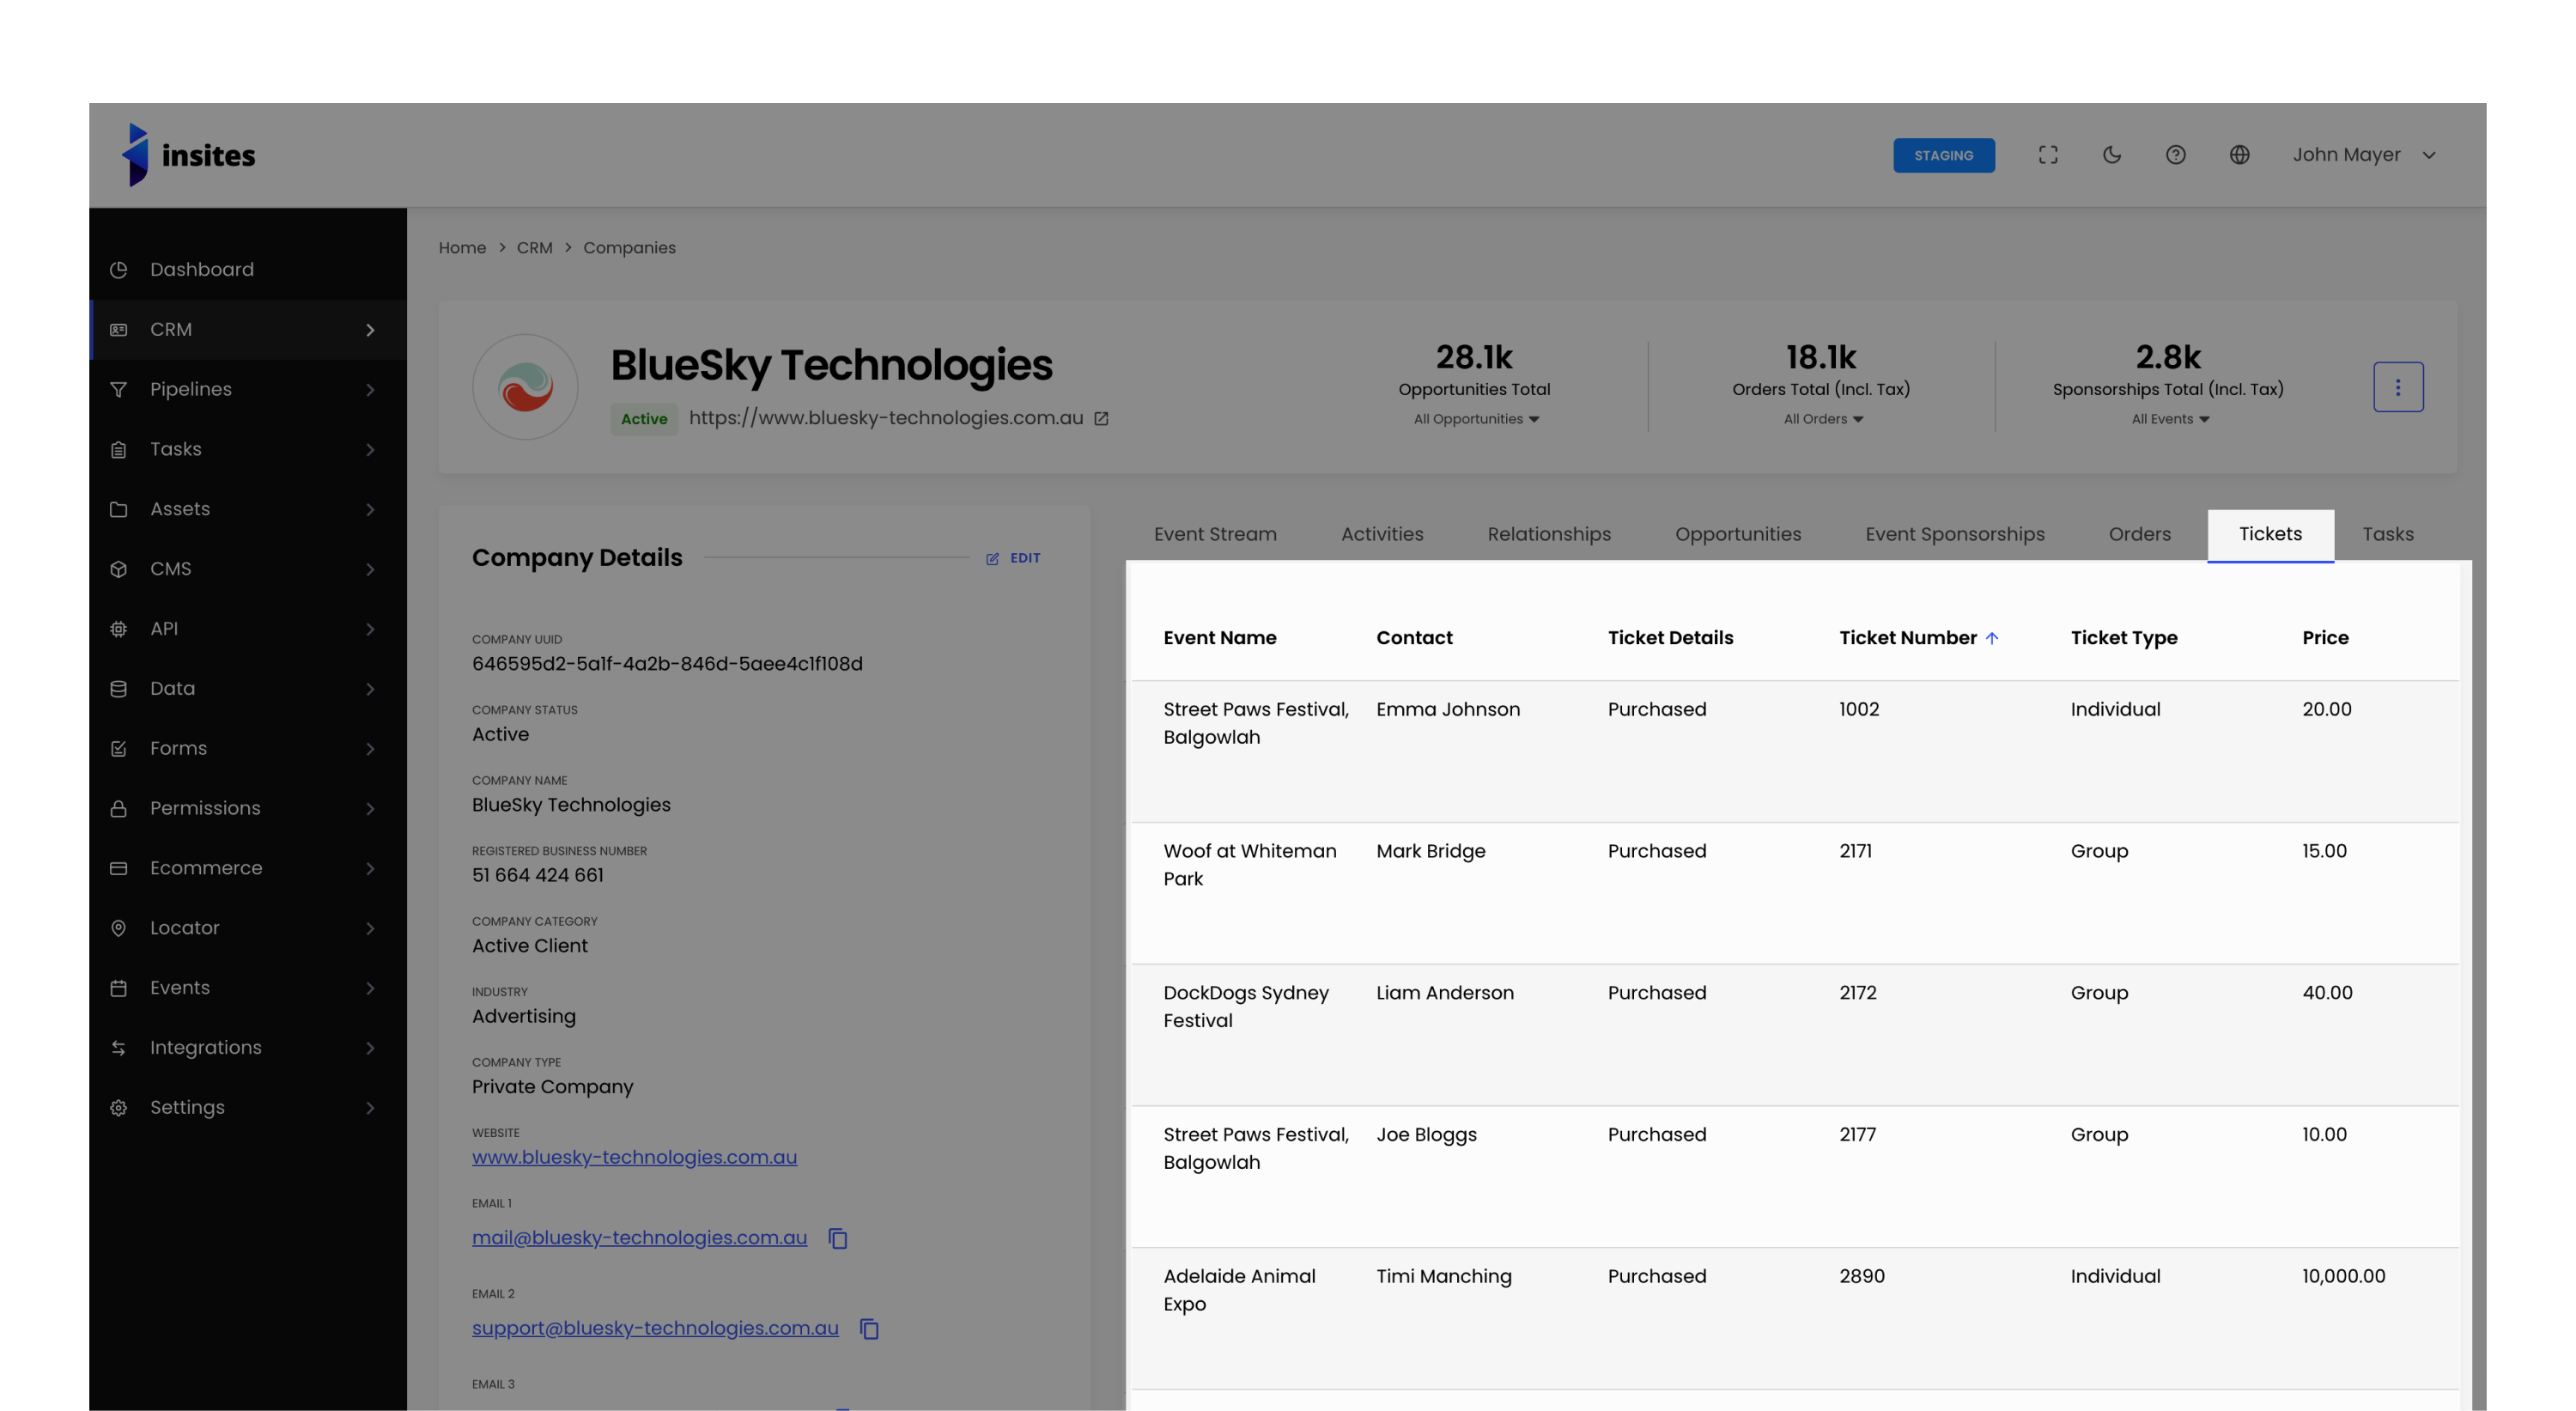
- Event Ticket Purchases - View all tickets purchased by a company directly from their company profile.
- SendGrid Account Management - You can now delete custom SendGrid accounts when they're no longer needed.
- Version Control Activity Stream - Track all version control changes in real time via the Event Stream.
- Admin Action Tracking - Administrator actions are now logged and visible in the Event Stream.
Improvements
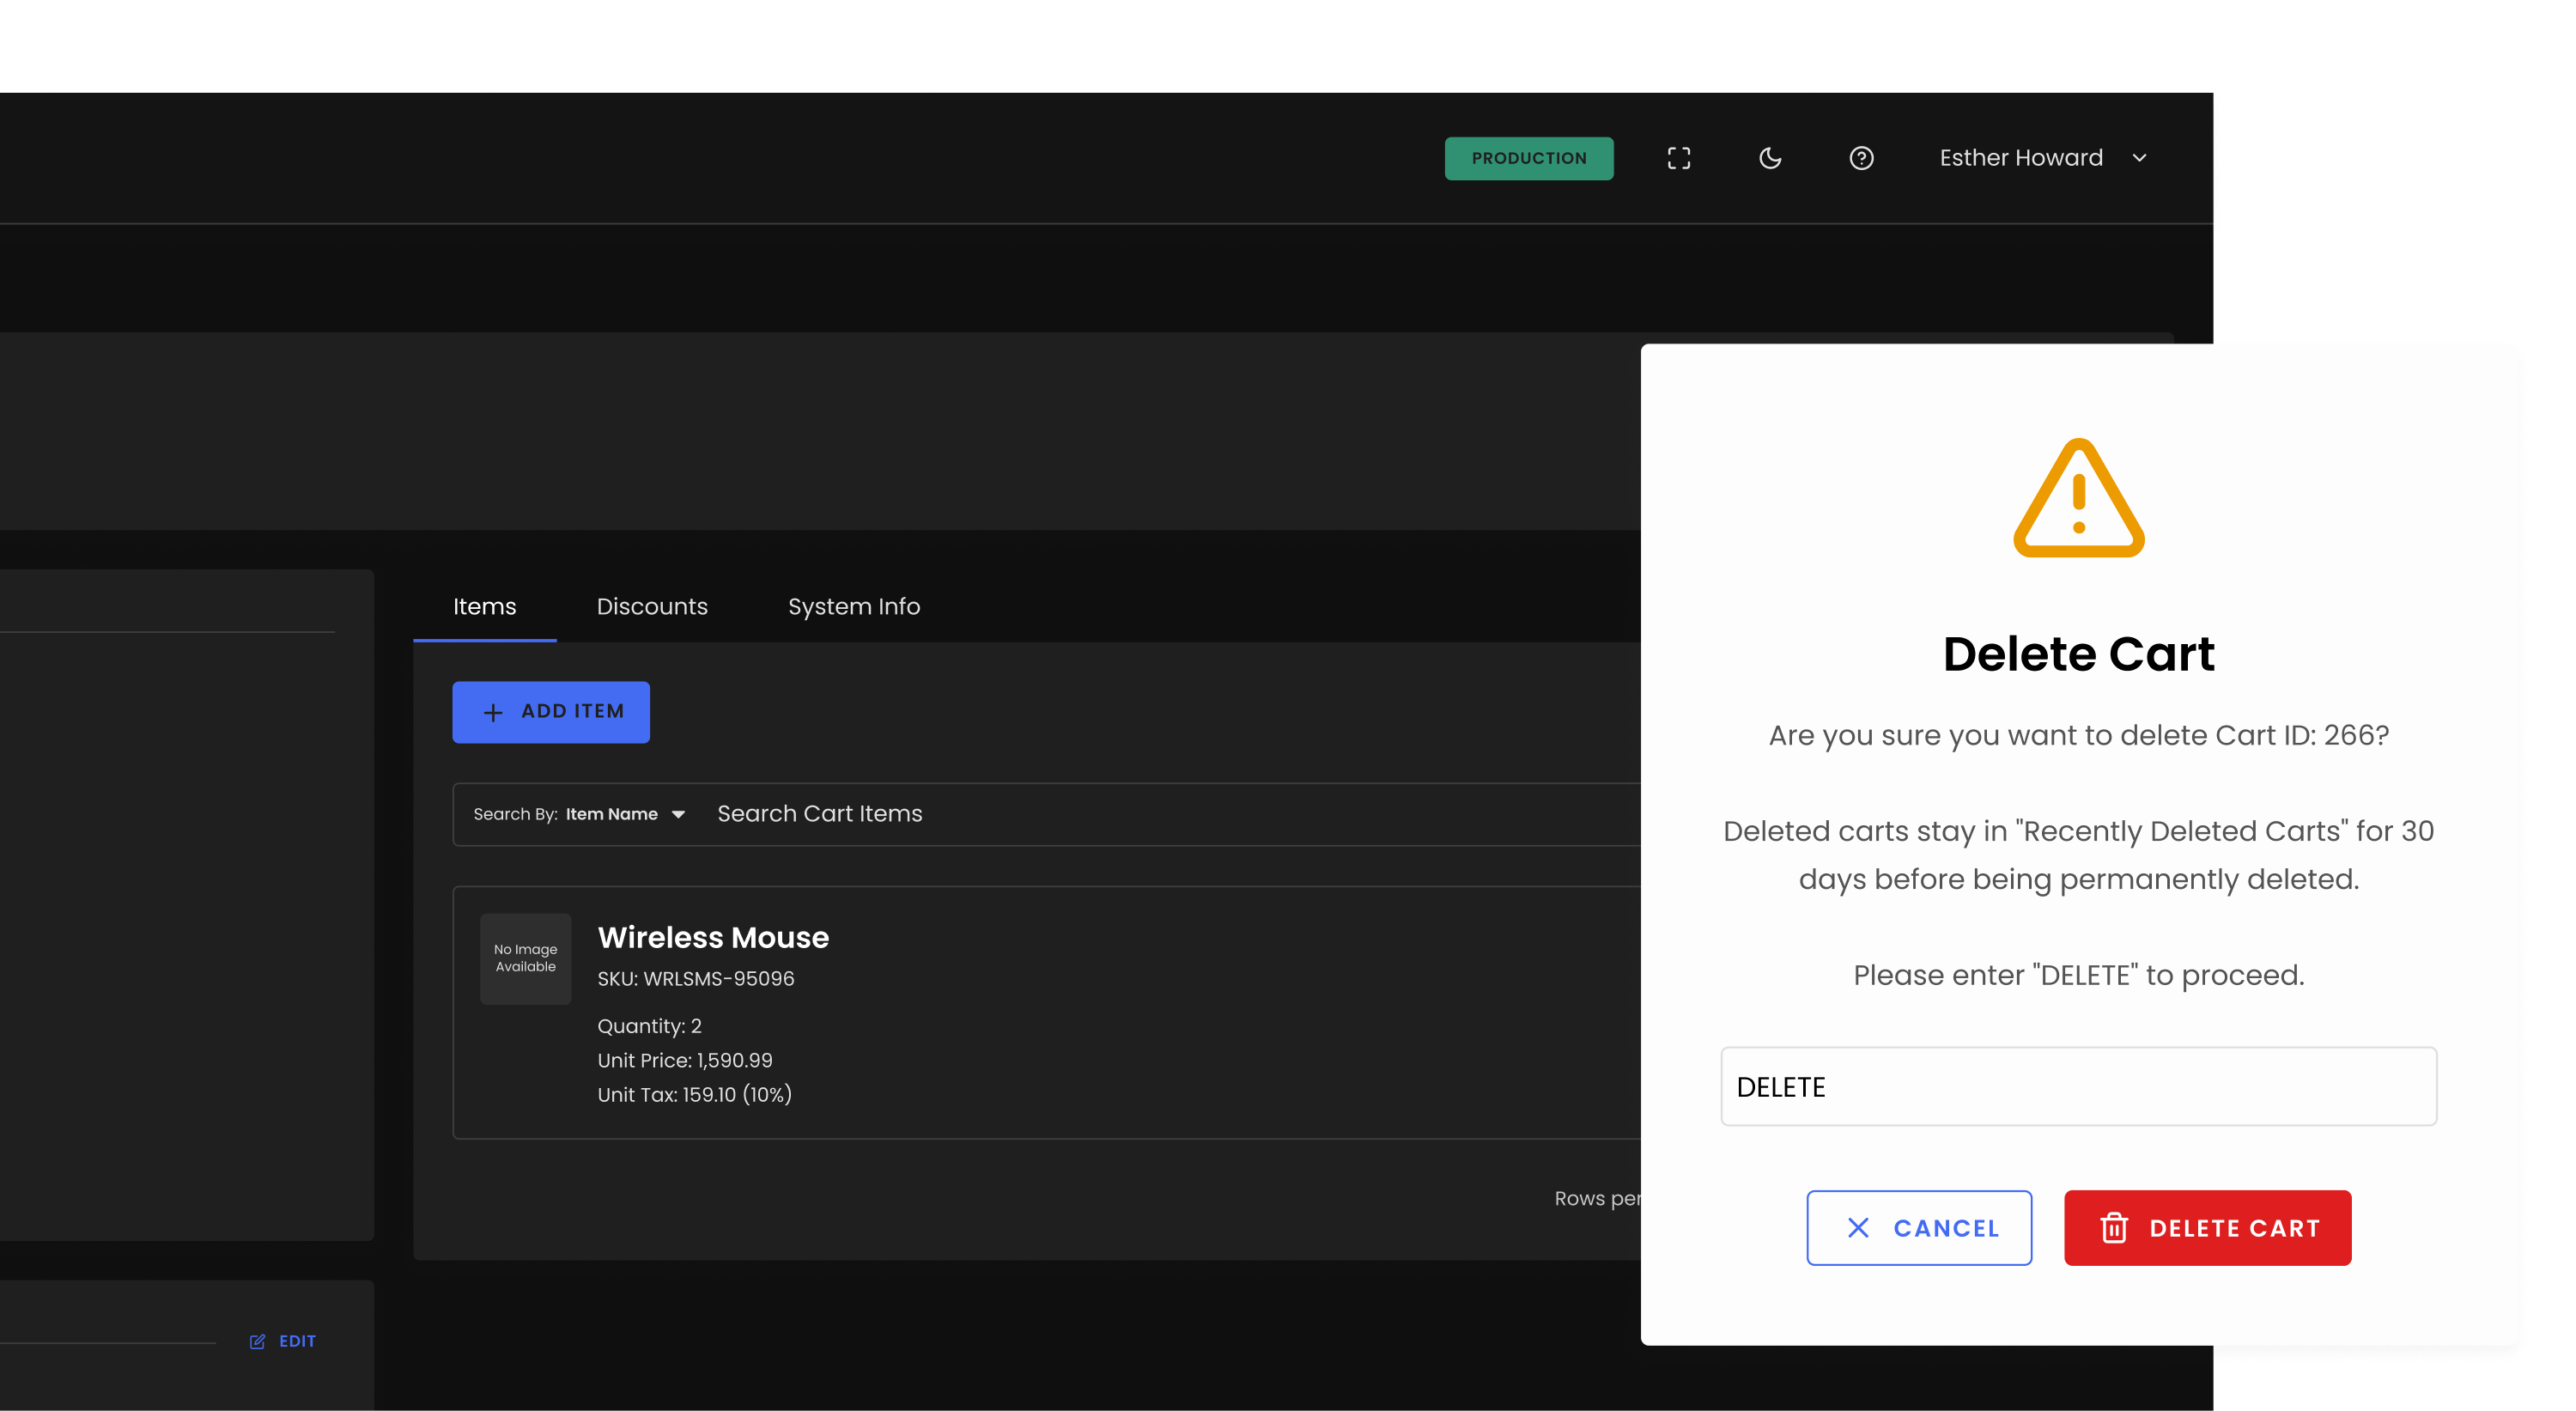
- Clearer Company Deletion - When deleting a company, you'll now see exactly what data will be removed and what will be kept.
- Company Profile Tabs - Improved layout and usability for the Opportunities, Event Sponsorships, and Orders tabs.
- Delete Confirmation - A clear warning message now appears before deleting a company.
- API Key Interface - Updated design for managing Instance API Keys.
- Advanced Filter - Boolean Fields - Boolean field type filters now work correctly in Advanced Filter.
- Advanced Filter - Address Fields - You can now filter CRM records by address fields.
- Redirects Interface - Cleaner, updated UI for managing redirects.
- CRM Export Filters - Export filters now apply correctly when exporting CRM data.
- Contact Prefix Options - More prefix choices available when creating or editing CRM contacts.
Bug Fixes
- Fixed an issue where bulk deleting companies could fail.
- Fixed incorrect values showing for event sponsorships on company profiles.
- Fixed column sorting on the Relationships tab of company profiles.
- Fixed contact imports when profiles are included.
- Fixed display issues for archiving and restoring contacts.
- Fixed Event Stream not displaying entries with a
log.actionvalue.
Optimized API endpoints and enhanced cart management
April 01, 2026
New Features
- V2 Get carts endpoint filter by contact_uuid,session_id,company_id
Improvements
- When deleting the cart, all of it’s cart_items must be deleted
- Cart Items V2 API
Bug Fixes
- Using partial modules/insites_ecommerce/seo, the code returns empty canonical which is flagged as an error by w3C
- Adding products with variants sometimes lead to double value
- Opening order details linked from Dashboard->Events Stream shows popup error.
- Order item is not added when adding order via IIA
- Cart Item total displayed is 0
- Updates to products should reflect in cart items (updated cart_item to be linked to product and not use screenshot of the product details)
- The computation for order_total is wrong when the product is_tax_included=true or is_sale_price_tax_included=true (for is_on_sale=true)
- Product variant get controller not working
- Table Data Styles
- Fix local storage for localisationData
Breaking Change
- Update all v2 PUT endpoint to PATCH
- Updated cart_item schema. Removed product snapshot details and now using the product details from product database.
New instance logs and Intercom support are now live
April 01, 2026
New Features
- Instance Logs
- A new "Logs" tab has been added to the instance settings page, providing users with details on how to connect the Insites CLI Tool to their instance and view logs directly.
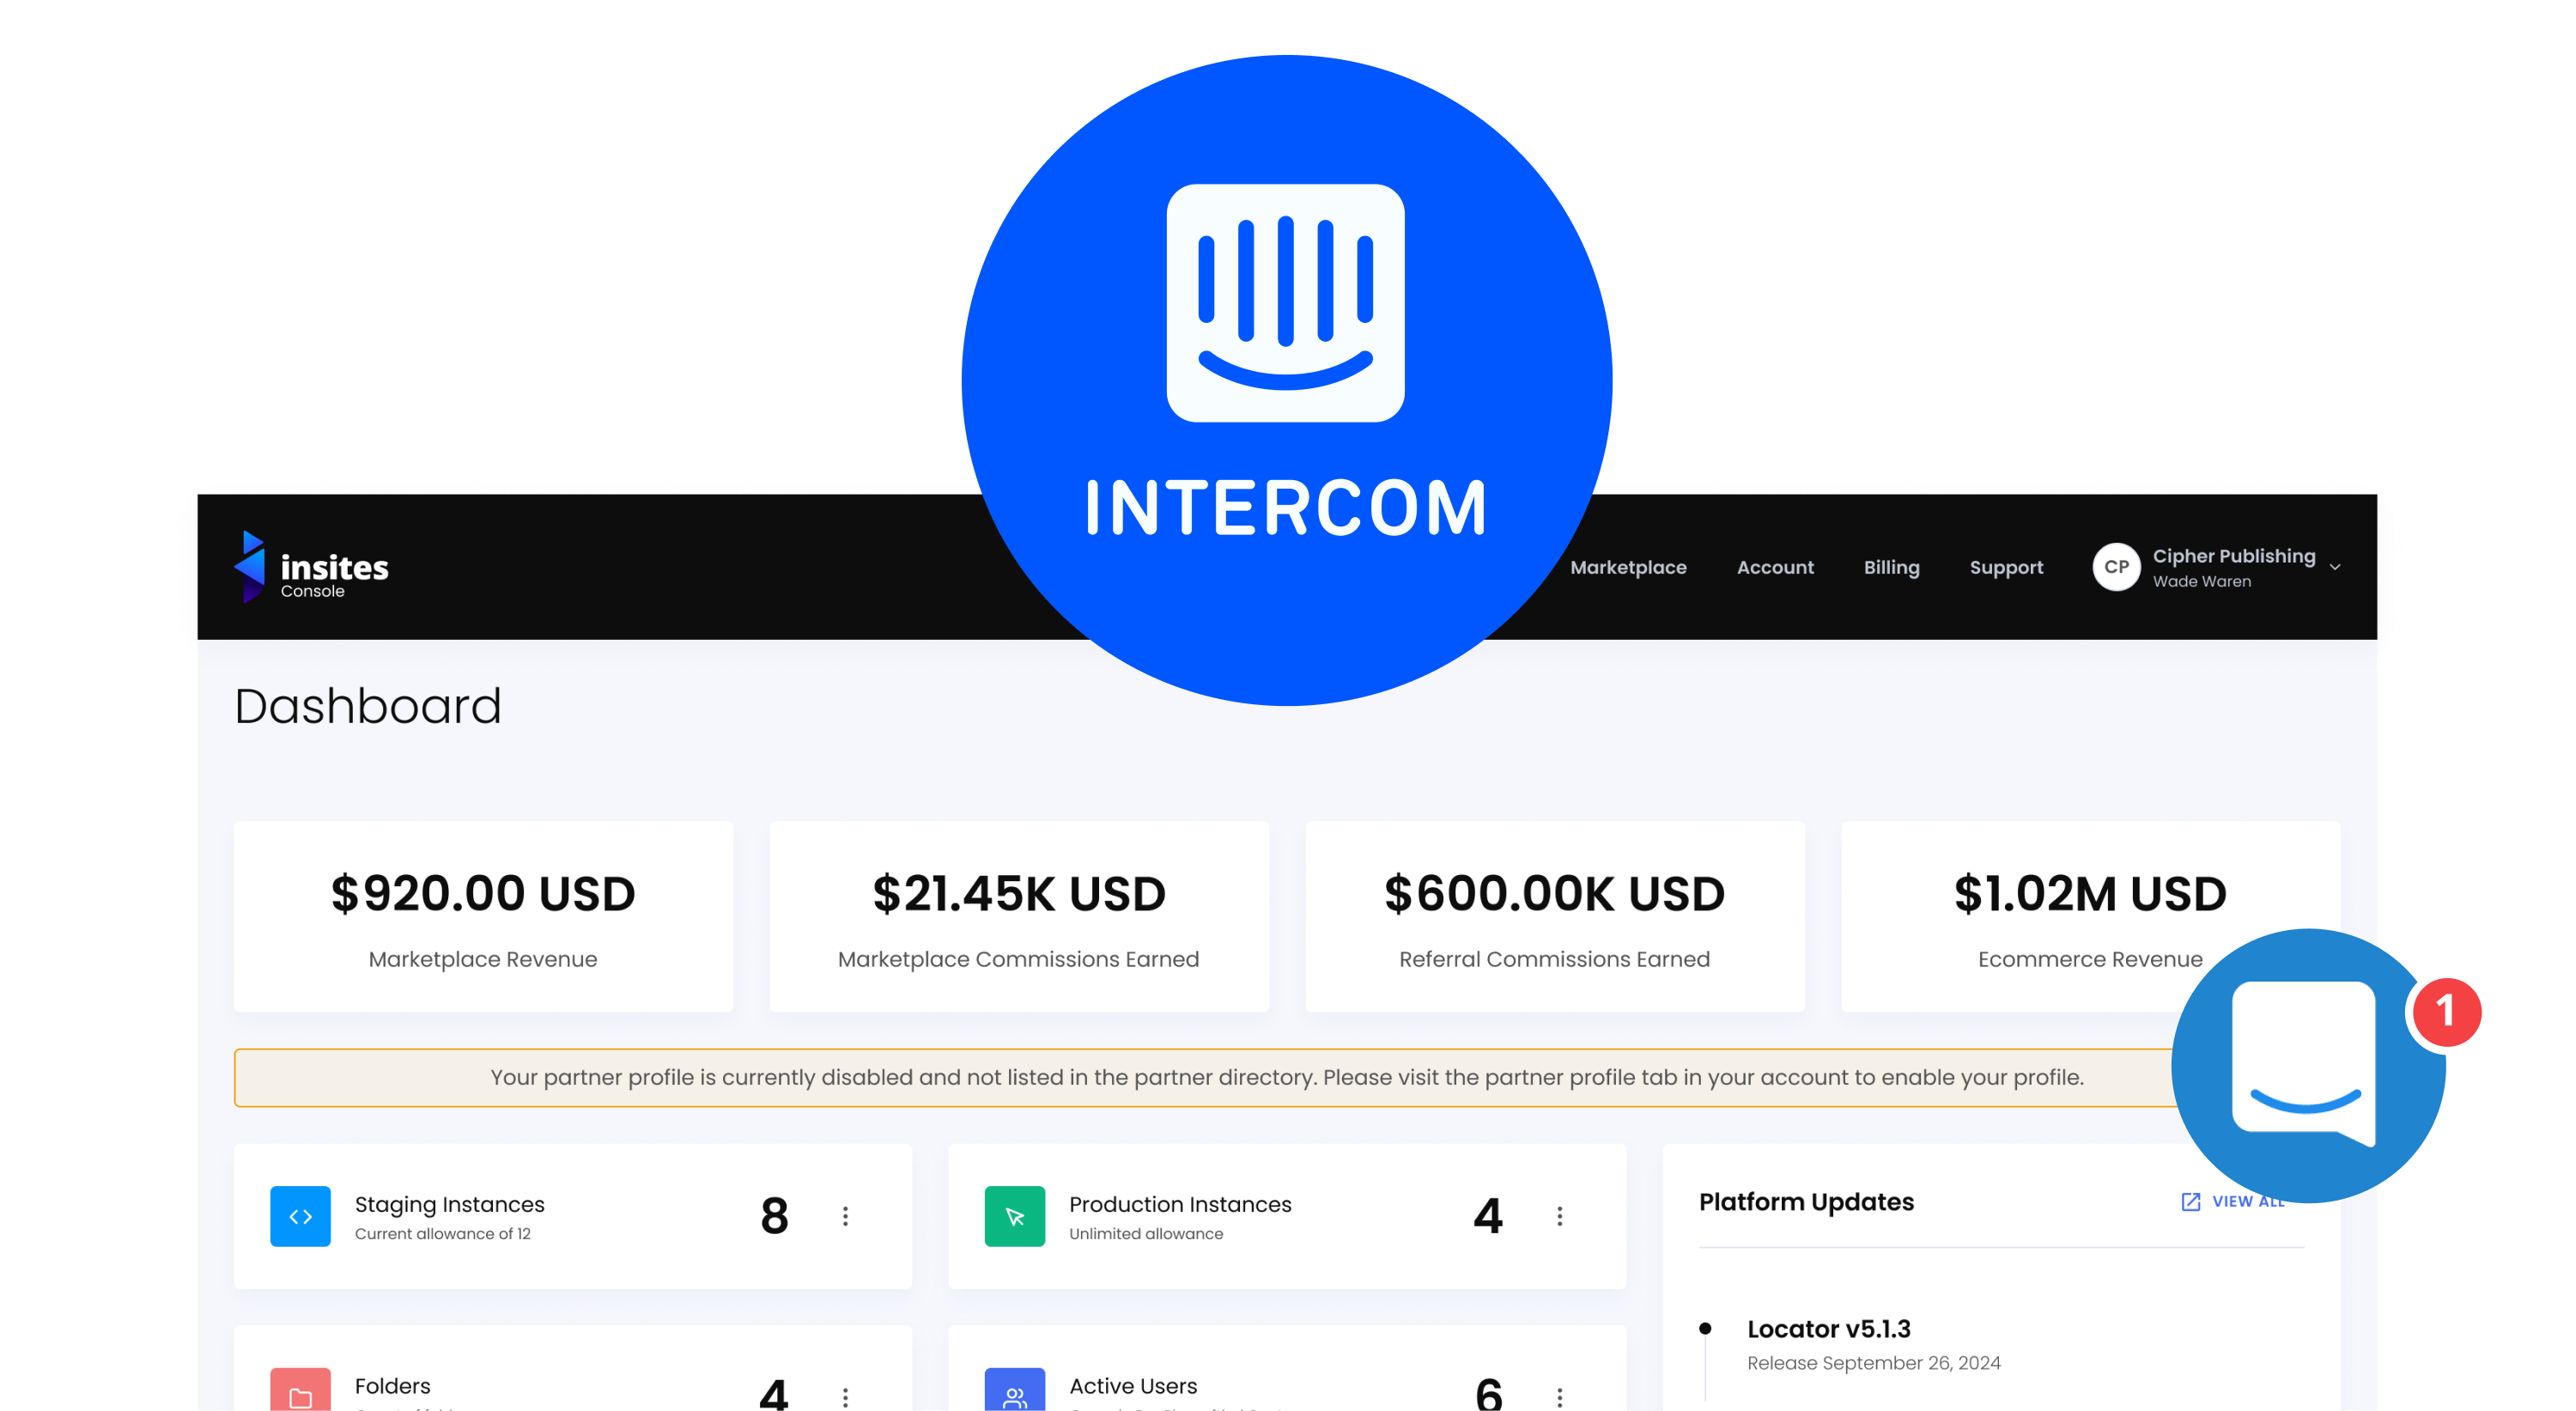
- Intercom Integration
- Intercom has been installed into the Console, enabling real-time customer support and communication within the platform.
Improvements
- Email Notifications
- Added instance environment (Staging/Production) to all email notification templates including SSO Failed, Domain Requests, New SSO, Marketplace Item Install, Instance Duplication, Create Instance Success/Fail, Delete Instance, and Module Update notifications.
- Standardised time format across all email notifications to use UTC.
- Fixed display of special characters in email subject lines.
- Pagination page number preferences are now stored per account, so switching between accounts retains each account's pagination state.
- Instance Display Enhancements
- The default domain is now shown as the display URL on instance cards and details pages.
- Added the default domain to the instance card information view.
- Changed the system domain tag colour for better visibility.
- Insites SSO
- SSO login now uses the default domain for instances.
- SSO login failure emails updated to display the default domain.
- Improved handling of SSO API endpoint failures with more user-friendly error messages instead of generic 401 responses.
- Instance Duplication
- Improved logging on failed instance duplication attempts.
- The user performing the duplication is now automatically added to the email allowed list on the duplicated instance.
- Source instance module versions are now correctly populated during duplication.
- Marketplace items are now properly installed on duplicated instances.
- Marketplace
- Fixed missing install button for Seedling and other marketplace items.
- Reviewed and fixed marketplace action button display logic for items without actions.
- General
- Increased session timeout duration to one month.
- Improved error messages across the platform for a better user experience.
Bug Fixes
- Fixed an issue where instance details page was not loading correctly.
- Fixed an issue where users were unable to view the instance frontend.
- Fixed SSO key not being created on new instances.
- Fixed an issue where SSO login failed on certain instances due to Elasticsearch errors.
- Resolved several additional minor bugs to enhance system stability and performance.
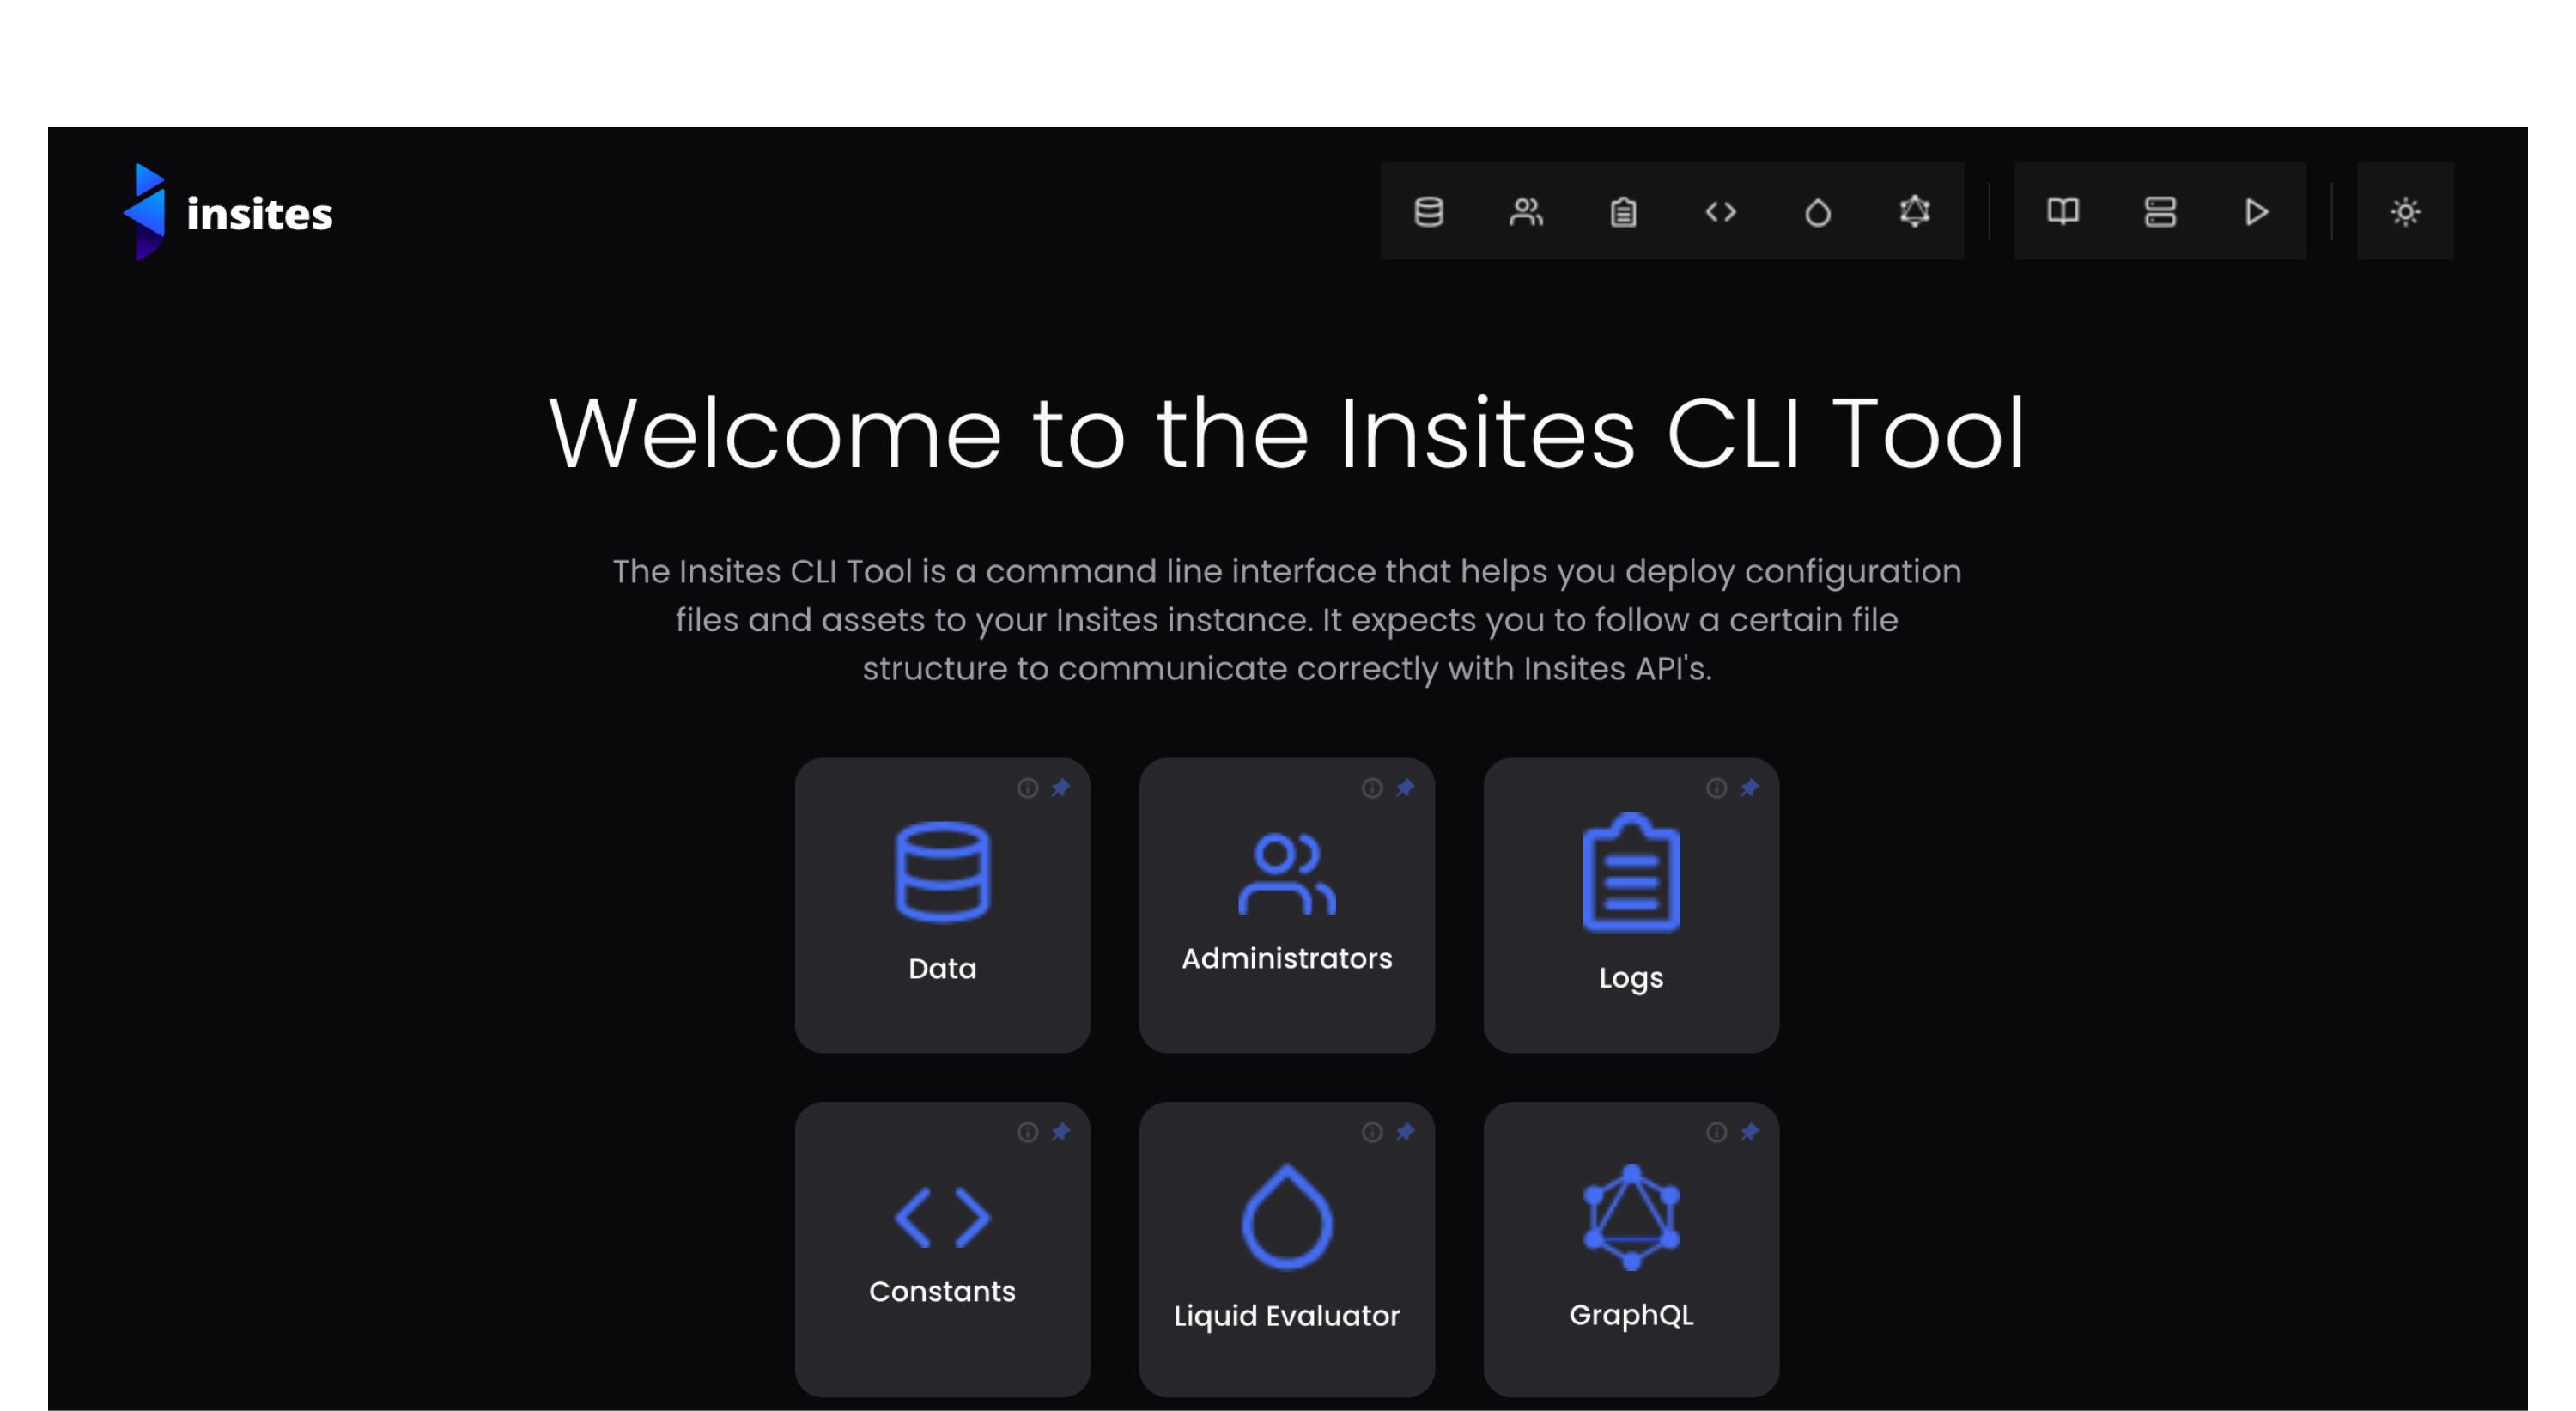
We have optimised the CLI tool and improved your database management experience
April 01, 2026
New Features
- Data export functionality added to the CLI tool.
- GraphiQL package updated to latest version.
- GraphQL GUI: tab/pin queries UX improvement.
- Instance duplication support reviewed and improved (duplicate init).
Bug Fixes
- Fixed Data Clean missing
promptsmodule in packages.json. - Fixed 401 client error response not being handled correctly.
- Fixed "No such file or directory" error.
- Fixed migrations generate command.
- Fixed CLI database issues.
- Fixed user list not displaying any users.
- Fixed filter-by select on the users page not working.
- Fixed database table item values not being displayed.
- Fixed database filter-by layout bug.
- Fixed database table search not working.
- Fixed database table items overflowing without scroll.
- Fixed constants page layout and loading issues.
- Fixed constants page returning "Page Not Found".
- Fixed saving a constant triggering a full page reload.
- Fixed incorrect padding on the logs list.
- Fixed GraphQL clear button not functioning.
Improvements
- Various stability and error handling improvements.
- Fixed missing scrollbar on navigation tabs.
- General styling improvements to the users page (headings, labels, buttons, spacing).
- Search input placeholder updated to "Search Users".
- Database search placeholders updated and row alignment improved.
- Added a confirmation prompt when deleting a constant.
- Increased the width of the constants input field.
- New constants now appear at the top of the list.
- Layout and button styling improvements to the Liquid and GraphQL pages.