
-
Console
Your command center to manage instances, permissions and billing.

Instances
An Instance is a virtual server that stores data and runs your application code.

Marketplace
Hosts applications, tools, and various files that you can download and install into an Instance.

Partners
Partners are experts in designing, building, and maintaining apps on Insites.

Support
Contact Insites Support for bugs, feature requests, and software development help.
Instances
Instantly available virtual server with built-in
features for your entire team.
CRM
CRM helps manage relationships with customers, suppliers, and third parties efficiently.

Assets
Insites enables you to upload and manage files such as images, and documents using Assets.

CMS
Manage your application content with ease via no-code builders.

Forms
Creating forms for users to input data into the system.

Pipelines
Your instance includes 'Pipelines' to manage opportunities by creating relevant stages.

Permissions
Manage user permissions and security for your application.

Data
Insites lets users view, create, and manage databases and content via the Instance Admin.

Ecommerce
The Insites Ecommerce module provides complete management of ecommerce activities.

Locator
The Locator lets you integrate your instance with Google Maps and customize it as you wish.

Events
Insites Events lets you manage schedules, tickets, and sponsorship on your instance.

API
Integrate with any tool or platform with bespoke Endpoints.

AI
Take advantage of the latest AI technology with your data.
-
Design System
A cohesive set of guidelines, patterns, and assets for a consistent, user-centered design.

Design System Overview
The Insites design system is a collection of reusable components, guided by clear standards.

Component Hierarchy
Learn how to customize components and how to structure your designs so they inherit attributes.

Font Icons
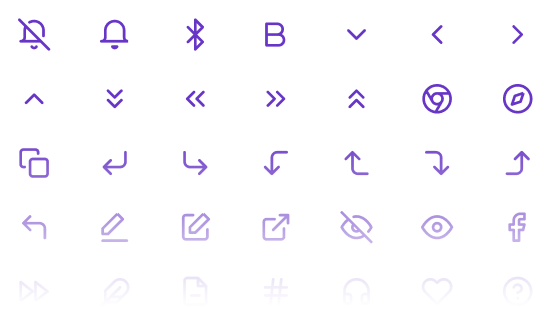
A full suite of font icons to use across your project within menus, buttons and quick links.

Color Styles
Figma color styles represent variables for Insites components, enabling quick customization.
Web Components
Build blazing-fast, consistent user interfaces with our web component library.

General
A wide variety or general use components such as buttons, carousel, gallery, headings, and loaders.

Layout
Useful layout components such as an accordion, backdrop, drawer, headers, modals, and more.

Data Entry
Collect data with components that include card select, checkbox, inputs, sliders, and editors.

Data Display
Create engaging interfaces with components such as Kanban boards, charts, tables, and timelines.
-
Developer Guide
Tutorials, references, and examples on how to build modern web applications on Insites.

Development
Covers key topics for setting up and maintaining web applications on Insites.

Modules
Modules enable code reuse and sharing while protecting creators' intellectual property.

Pages and Layouts
Learn how to implement pages and rendering content on your Instance.

Databases and Users
Discover how to create custom data models, import/export data and manage users.
CLI Tool
The Insites CLI Tool helps you deploy configuration
files and assets to your Insites Instance.
Get Started
Guides you through the requirements and steps to install and start using the Insites CLI Tool.

Commands and Options
Learn the commands and options for managing configurations in the Insites CLI.

Graphical User Interface
Discover how using the GUI can enhance your workflow by simplifying complex processes.

Code Linting
Automatically check your codebase for programmatic and stylistic errors when deploying.

GraphQL
A data query and manipulation language that allows you to specify the data you require.

Liquid
Liquid is a template language for creating dynamic pages, content and configurations.

API Docs
Learn about the functionalities and structure of the inbuilt API Endpoints of your instance.

Web Applications
Discover how to create your web application with step by step guides and helpful examples.
- Articles
- Change Log
- Support
-
Console
Your command center to manage instances, permissions and billing.
Instances
An Instance is a virtual server that stores data and runs your application code.
Marketplace
Hosts applications, tools, and various files that you can download and install into an Instance.
Partners
Partners are experts in designing, building, and maintaining apps on Insites.
Support
Contact Insites Support for bugs, feature requests, and software development help.
Instances
Instantly available virtual server with built-in
features for your entire team.
CRM
CRM helps manage relationships with customers, suppliers, and third parties efficiently.
Assets
Insites enables you to upload and manage files such as images, and documents using Assets.
CMS
Manage your application content with ease via no-code builders.
Forms
Creating forms for users to input data into the system.
Pipelines
Your instance includes 'Pipelines' to manage opportunities by creating relevant stages.
Permissions
Manage user permissions and security for your application.
Data
Insites lets users view, create, and manage databases and content via the Instance Admin.
Ecommerce
The Insites Ecommerce module provides complete management of ecommerce activities.
Locator
The Locator lets you integrate your instance with Google Maps and customize it as you wish.
Events
Insites Events lets you manage schedules, tickets, and sponsorship on your instance.
API
Integrate with any tool or platform with bespoke Endpoints.
AI
Take advantage of the latest AI technology with your data.
-
Design System
A cohesive set of guidelines, patterns, and assets for a consistent, user-centered design.
Design System Overview
The Insites design system is a collection of reusable components, guided by clear standards.
Component Hierarchy
Learn how to customize components and how to structure your designs so they inherit attributes.
Font Icons
A full suite of font icons to use across your project within menus, buttons and quick links.
Color Styles
Figma color styles represent variables for Insites components, enabling quick customization.
Web Components
Build blazing-fast, consistent user interfaces with our web component library.
General
A wide variety or general use components such as buttons, carousel, gallery, headings, and loaders.
Layout
Useful layout components such as an accordion, backdrop, drawer, headers, modals, and more.
Data Entry
Collect data with components that include card select, checkbox, inputs, sliders, and editors.
Data Display
Create engaging interfaces with components such as Kanban boards, charts, tables, and timelines.
-
Developer Guide
Tutorials, references, and examples on how to build modern web applications on Insites.
Development
Covers key topics for setting up and maintaining web applications on Insites.
Modules
Modules enable code reuse and sharing while protecting creators' intellectual property.
Pages and Layouts
Learn how to implement pages and rendering content on your Instance.
Databases and Users
Discover how to create custom data models, import/export data and manage users.
CLI Tool
The Insites CLI Tool helps you deploy configuration
files and assets to your Insites Instance.
Get Started
Guides you through the requirements and steps to install and start using the Insites CLI Tool.
Commands and Options
Learn the commands and options for managing configurations in the Insites CLI.
Graphical User Interface
Discover how using the GUI can enhance your workflow by simplifying complex processes.
Code Linting
Automatically check your codebase for programmatic and stylistic errors when deploying.
GraphQL
A data query and manipulation language that allows you to specify the data you require.
Liquid
Liquid is a template language for creating dynamic pages, content and configurations.
API Docs
Learn about the functionalities and structure of the inbuilt API Endpoints of your instance.
Web Applications
Discover how to create your web application with step by step guides and helpful examples.
- Articles
- Change Log
- Support
Console
Your command center to manage instances, permissions and billing.
Instances
An Instance is a virtual server that stores data and runs your application code.
Marketplace
Hosts applications, tools, and various files that you can download and install into an Instance.
Partners
Partners are experts in designing, building, and maintaining apps on Insites.
Support
Contact Insites Support for bugs, feature requests, and software development help.
Instances
Instantly available virtual server with built-in features for your entire team.
CRM
CRM helps manage relationships with customers, suppliers, and third parties efficiently.
Assets
Insites enables you to upload and manage files such as images, and documents using Assets.
CMS
Manage your application content with ease via no-code builders.
Forms
Creating forms for users to input data into the system.
Pipelines
Your instance includes 'Pipelines' to manage opportunities by creating relevant stages.
Permissions
Manage user permissions and security for your application.
Data
Insites lets users view, create, and manage databases and content via the Instance Admin.
Ecommerce
The Insites Ecommerce module provides complete management of ecommerce activities.
Locator
The Locator lets you integrate your instance with Google Maps and customize it as you wish.
Events
Insites Events lets you manage schedules, tickets, and sponsorship on your instance.
API
Integrate with any tool or platform with bespoke Endpoints.
AI alpha
Take advantage of the latest AI technology with your data.
Design System
A cohesive set of guidelines, patterns, and assets for a consistent, user-centered design.
Design System Overview
The Insites design system is a collection of reusable components, guided by clear standards.
Component Hierarchy
Learn how to customize components and how to structure your designs so they inherit attributes.
Font Icons
A full suite of font icons to use across your project within menus, buttons and quick links.
Color Styles
Figma color styles represent variables for Insites components, enabling quick customization.
Web Components
Build blazing-fast, consistent user interfaces with our web component library.
General
A wide variety or general use components such as buttons, carousel, gallery, headings, and loaders.
Layout
Useful layout components such as an accordion, backdrop, drawer, headers, modals, and more.
Data Entry
Collect data with components that include card select, checkbox, inputs, sliders, and editors.
Data Display
Create engaging interfaces with components such as Kanban boards, charts, tables, and timelines.
Developer Guide
Tutorials, references, and examples on how to build modern web applications on Insites.
Development
Covers key topics for setting up and maintaining web applications on Insites.
Modules
Modules enable code reuse and sharing while protecting creators' intellectual property.
Pages and Layouts
Learn how to implement pages and rendering content on your Instance.
Databases and Users
Discover how to create custom data models, import/export data and manage users.
CLI Tool
The Insites CLI Tool helps you deploy configuration
files and assets to your Insites Instance.
Get Started
Guides you through the requirements and steps to install and start using the Insites CLI Tool.
Commands and Options
Learn the commands and options for managing configurations in the Insites CLI.
Graphical User Interface
Discover how using the GUI can enhance your workflow by simplifying complex processes.
Code Linting
Automatically check your codebase for programmatic and stylistic errors when deploying.
GraphQL
A data query and manipulation language that allows you to specify the data you require.
Liquid
Liquid is a template language for creating dynamic pages, content and configurations.
API Docs
Learn about the functionalities and structure of the inbuilt API Endpoints of your instance.
Web Applications
Discover how to create your web application with step by step guides and helpful examples.